Any Excel (chart) experts out there? For food plot management.

MadMadHoosier

5 year old buck +
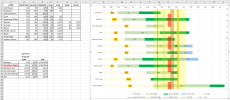
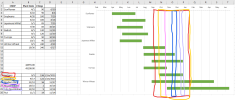
So I'm spending way too much time on this, but I'd like to create a spreadsheet/chart that will visually display several aspects of my planting plan on a chart. So far I've got the stacked bar chart showing the plant/germination dates in a suitable format. (my newest version looks even better than the image below) Now I'd like to further mimic another chart I've seen elsewhere, by drawing perimeter or shaded boxes around some time frames for various seasons or events. See my hand drawing of the boxes below for some examples. I've experimented with combo charts and other methods, but have not found anything that will work just yet.
I know I could skip the chart function and just manually format and shade some cell ranges to get a similar effect, but I'm determined to do it with the chart function if at all possible. Any Excel experts out there that could point me in the right direction? Once this is figured out, I'm also planning to add my Gen5 gate and clutch settings, and #'s per acres into the spreadsheet. I'll happily share my results if I end up creating anything worthwhile.
Thanks, Steve.
ComboChart.png

Thanks, Steve.
 
Maybe. I'm not really sure what it wants to look like. Conditional formatting for the cells? You want the cells containing numbers to look different depending on the value? You might need to rethink you table design. Rows contain the event and columns the date? Start Date in a column D for example and End Date in Column E for example and the number of days in an adjacent column? Again, I'm not clear on the final picture.
1647112227874.png

1647112280908.png
 
Last edited:
Steve,

There are a number of ways to do something like that. You could use drawing tools in excel to draw in rectangle on the chart and format it accordingly. This is the easiest if the chart x-axis will always to be same. The rectangles will stay in the same place if the chart axis changes and will no long be correct. The most flexible method is to us VBA but you need some programming skills for that.

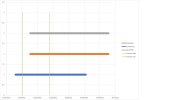
Another way to do it is to use a scatter plot with lines rather than combining two chart types on one chart. Here is an example of one way to convey similar information. The char below is a scatter diagram with lines. I just used arbitrary data. The horizontal series represent your crops. It is a simple line with the start and end dates for the X values. The y values for each line is just a simple (1,1), (2,2), and (3,3) for each series respectively. I then formatted the likes to look more like a bar chart by making them 10 points wide. The vertical lines represent seasons. You need two series per season, one for the start and one for the end. The first line for Archery Start has two x data points which are the same (the start date), and the y data points are (0,4). The Archery End is the same just using the end dates instead of start dates. I made both lines green. You could use a different line color for each season. They are not boxes, but it does convey the same information.

Chart_Example.jpg
 
By the way, the y-axis is just arbitrary values. You can make that range bigger to add more crops. You can also just hide the Y axis since it has no real meaning.
 
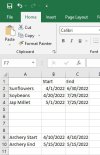
Here is the little spreadsheet that does with that chart I posted.

Screenshot 2022-03-12 160417.jpgT

Sunflowers has a fixed x value of 1 for both start and end that I just typed into the series for the chart. Likewise,, Soybeans 2, and Millet, 3. Archery start and archery end both the hard coded x value of zero for Start column and 4 for the end column.
 
A Gantt chart might be the ticket
Yes, good idea. You can combine chart type by using a traditional Gantt chart as the primary chart for crops, and then adding the Season Start and Season End dates changing the chart type for those to Scatter plots with lines like in my chart above. It is a little more complicated to use multiple chart types together on one chart and I wasn't sure just how much experience the OP had with excel.

Thanks,

Jack

I guess I was thinking of just using bars and no columns. A bar for Soybeans 1 and Soybeans2 spanning the dates of interest and another bar for the Hunting Seasons date ranges. I know the original idea was bars and columns, but, like you said Jack, it takes some beyond-the-basics manipulation.
 
Steve,

There are a number of ways to do something like that. You could use drawing tools in excel to draw in rectangle on the chart and format it accordingly. This is the easiest if the chart x-axis will always to be same. The rectangles will stay in the same place if the chart axis changes and will no long be correct. The most flexible method is to us VBA but you need some programming skills for that.

Another way to do it is to use a scatter plot with lines rather than combining two chart types on one chart. Here is an example of one way to convey similar information. The char below is a scatter diagram with lines. I just used arbitrary data. The horizontal series represent your crops. It is a simple line with the start and end dates for the X values. The y values for each line is just a simple (1,1), (2,2), and (3,3) for each series respectively. I then formatted the likes to look more like a bar chart by making them 10 points wide. The vertical lines represent seasons. You need two series per season, one for the start and one for the end. The first line for Archery Start has two x data points which are the same (the start date), and the y data points are (0,4). The Archery End is the same just using the end dates instead of start dates. I made both lines green. You could use a different line color for each season. They are not boxes, but it does convey the same information.

View attachment 41844

Thanks for all the replies. I have played around with gantt charts and combo charts. Gantt alone does not look like what I want. The combo chart seems promising, but every time I try to add data to the 2nd type, it messes up the formatting in my 1st. I'm still bullheaded enough that I'm going to try to make the chart function work, before I resort to just formatting cells. The bar graphs in formatted cells give one aspect, but will not give me the stacked timeline I'm hoping for.

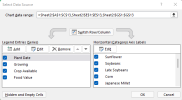
Your vertical lines above seem as workable as the peremiter or shaded boxes I originally envisioned. Especially if I get them color coded in a nice way. Would you mind showing a snipped of your "select data source" dialogue box? I think that will help me understand how you inserted the vertical lines.

dataSource.png

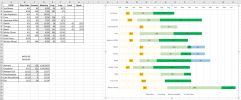
I've been busy with other projects today and am bushed, so I'll give that approach a try tomorrow. Here is the latest version of my stacked bar chart. I'm still hoping to tweak it a little more to show when each crop is most interesting to the (deer) wildlife. Thanks again so much, Steve.


stackedBarChart.png
 
Here ya go:

Chart_Example2.jpg

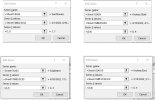
This is from the previous example spreadsheet. I showed the edit/series (or what you would use for the add series) for two crops on the left and the archery start and end vertical lines on the right. Let me know if this helps.
 
Here ya go:

View attachment 41850

This is from the previous example spreadsheet. I showed the edit/series (or what you would use for the add series) for two crops on the left and the archery start and end vertical lines on the right. Let me know if this helps.
Yoderjac
This was very helpful! I started out trying to use the scatter chart, but then it seemed I was going to lose the stacked bar aspect for the various stages of each crop. But your "edit series" snipets helped me understand how I could properly format the combo (stacked bar & scatter) chart, and I've just added Archery Beg & Archery End. I'm going to play around with it and see if each seasons Beg-End gets too cluttered, or if there is a better way for me to present them on the chart. THANK YOU SO MUCH!!!!!

ComboChart2.png
 
Looks good, glad to help.
 
Looks good, glad to help.
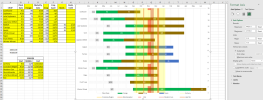
It's evolving. I did not like a beginning and ending line for each season as you really had to look hard to decipher which line went with which key. Then noticed I could play around with the line thickness and transparency of a single line to mimic my desired shaded boxes. I calculated a date in the center of the beginning and ending of each season and that placed the box well on the calendar as the line thickness expanded. Now I need tweak the alignment of the month axis a little bit and work on the colors to be more aesthetically pleasing. Then I can do the easy part of tweaking my data cells and names so any time they are adjusted the chart automatically reflects those adjustments.
Without your guidance I would still be staring at it wondering what to do - so thanks again!

ComboChart3.png
 
It's evolving. I did not like a beginning and ending line for each season as you really had to look hard to decipher which line went with which key. Then noticed I could play around with the line thickness and transparency of a single line to mimic my desired shaded boxes. I calculated a date in the center of the beginning and ending of each season and that placed the box well on the calendar as the line thickness expanded. Now I need tweak the alignment of the month axis a little bit and work on the colors to be more aesthetically pleasing. Then I can do the easy part of tweaking my data cells and names so any time they are adjusted the chart automatically reflects those adjustments.
Without your guidance I would still be staring at it wondering what to do - so thanks again!

View attachment 41854
Yes, you can play with thickness and transparency but need to center your line on the middle of the season. Glad you found what you need.
 
Yes, you can play with thickness and transparency but need to center your line on the middle of the season. Glad you found what you need.
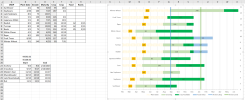
I did calc the middle of the season to properly display the thickened line on the chart. And I think I now have this good enough for my needs. My primary goal was to have a visual representation of when crops would mature and be available for the various hunting seasons - relative to their planting date. I can modify any of the Yellow data cells to the left, and the chart will automatically update.
One last thing I'd fix if you can offer an idea how. The Month axis at the top of the chart is not perfectly represented relative to the dates being plotted below. I was hoping each vertical line would represent the first day of the month. However, the only way I saw to get the months to display at the top, was to set my min/max bounds for a date range, and then set the major units to 31.
Is there any (easy) way to truly get the line and month label exactly on the first day of the month? If not, it is still plenty close enough for my needs.
Thanks again, Steve.
PS: I'm happy to share this sheet with anyone who would like a copy.

ComboChart4.png
 
Top